The Rapid Elearning Blog

Archive for July, 2009


PowerPoint is an important part of the rapid elearning world.  If you want to build good elearning courses, you really have to learn to use PowerPoint and it’s many features.

The challenge for many rapid elearning developers is that you have limited time to learn the tools because the expectation is that since you have rapid elearning software you’ll be able to get your work done rapidly.

A great way to learn to use PowerPoint and to get better at building your courses is to look for other work that inspires you and then try to replicate it.  The process of replicating the work teaches you new techniques that you’ll have for the rest of your rapid elearning career.

I regularly scan the Internet for interesting Flash animations or web sites.  When I find one I like, I’ll see what I can replicate in PowerPoint.  Sometimes I can and sometimes I can’t.  It doesn’t always matter.  The real value is in the process of trying.  That’s where the learning happens. 

The other day, I was moving some files around and found an old screenshot I took of a web site.  I liked the colors and layout.  I thought it might make an interesting PowerPoint slide show, so I saved it to play around with at a later date.  Well, today is the later date.

Today, I will show you how to create a PowerPoint elearning template.  We’re going to use the screen shot as a starting point, but this isn’t about copying the image.  Instead, it’s about the process you go through as you copy it.  The idea is to grow in your visual design skills, learn some techniques, and then learn to build it in PowerPoint.  The production process in PowerPoint helps you become more efficient and faster when building courses.

Original Screen Capture

Here’s our starting screen shot.  It’s from the web site for the  Flock browser (which is pretty cool by the way).  I liked the blue color.  I also like the transition from light to dark in the background.  It gives the image depth and it helps the main part of the screen pop out.  I also like the orange accent.  It’s a great way to draw attention to key points.

The Rapid E-Learning Blog - inspiring design from Flock

PowerPoint Template

Here’s the PowerPoint version of the Flock design.  You can see that it’s not an exact duplicate.  Instead, I brought in the elements that I liked, which was mainly the colors.  Also, I had two main goals with this.  I wanted to build it all in PowerPoint and I wanted to keep it simple so that I can make it quickly.
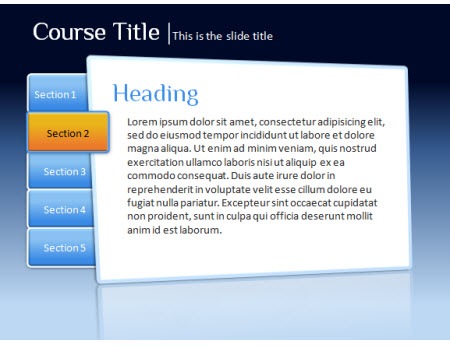
The Rapid E-Learning Blog - PowerPoint template design

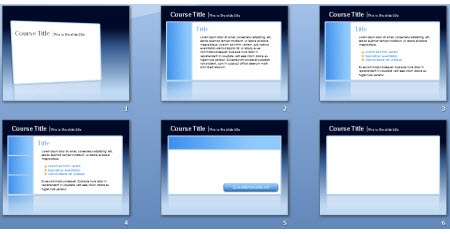
The Rapid E-Learning Blog - iterations for elearning PowerPoint template 

When I built templates for elearning courses, I usually build variations of the screen.  What I want is a few iterations of the general look and feel so that I can accommodate different kinds of content.  For example, the first image I’d use for a title or section screen.  However, the last image might be what I use for a screen where I insert multimedia like a video or Flash file.

For this demo, I built everything inside the PowerPoint file and saved it as a .ppt. However, your best bet is to build it as a master file and then save as a PowerPoint template (.pot).

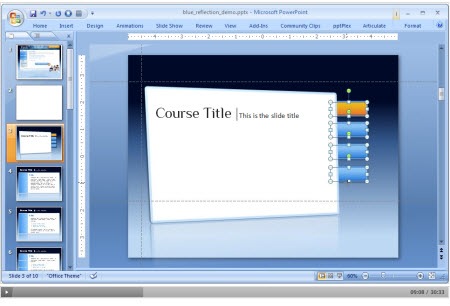
I put together a demo that shows you how I built it in PowerPoint.  I also attached the file and made some images out of the PowerPoint objects so you can use them as you wish.

The Rapid E-Learning Blog - tutorial on how to desing PowerPoint templates for elearning

Click here to view the tutorial (30 min).

Feel free to fast forward through the tutorial.  Here’s what’s covered:

  • Analyze the visual design and determine what you like and why
  • Build the template graphics in PowerPoint
  • Save what you build as graphic files
  • Create a few iterations of the design to accommodate different needs
  • Build accent pieces and boxes
  • Use design color schemes in PowerPoint 2007
  • Share with others and they’ll share with you…hopefully.

Click here to download the PowerPoint template and images

As promised, here’s a link to download the files I created.  The folder contains .ppt and .pptx files and some graphics.  I used the Philosopher font which is free and you can download it here.

Got any tips and tricks you’d like to share when building rapid elearning courses in PowerPoint?  Share them by clicking on the comments link.

Here’s another post about building PowerPoint templates:

Events

Free E-Learning Resources

Want to learn more? Check out these articles and free resources in the community.

Here’s a great job board for e-learning, instructional design, and training jobs

Participate in the weekly e-learning challenges to sharpen your skills

Get your free PowerPoint templates and free graphics & stock images.

Lots of cool e-learning examples to check out and find inspiration.

Getting Started? This e-learning 101 series and the free e-books will help.


One of my favorite parts of designing elearning courses is coming up with some treatments or ideas that we can present to the client.  I’m always playing around with ideas.  Most of them are kind of goofy and not always appropriate for the client’s project.

However, it’s okay to come up with dumb ideas.  The process of playing around and thinking about different ways to approach the course will ultimately help you come up with some pretty cool ideas. Besides there are enough boring elearning courses to provide balance to the occasional dumb idea. 🙂

At some organizations, we’d regularly schedule a session where all we did was spend about an hour or two coming up with ideas for courses.  Then we’d narrow it down to about twenty good ones that we could pull out of the hat for our client meetings. 

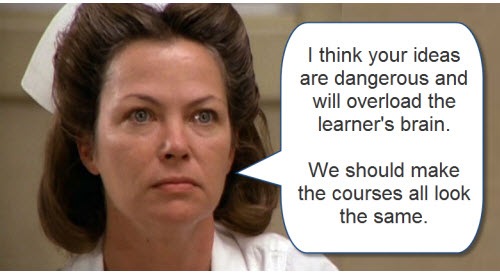
There’s a lot of value in this.  It’s a great way to jump start your next project.  You also get your creative juices flowing and learn to think about things in different ways.  In addition to all of that, it’s usually pretty fun and a great way to build camaraderie (unless of course, one of your team mates is the elearning equivalent of Nurse Ratched).

nurse

In today’s post, I thought I’d offer some ideas that I was thinking about this week.  You might like them, you might not.  The point isn’t so much that it’s an idea that will really work for you.  Instead, it’s a springboard to help get some ideas flowing.

Magazine Cover

The other day as I was getting a glass of water, I saw a woman’s magazine on our kitchen counter and noticed a headline on the cover.  It read, “10 Things Men Want Women to Know (But Won’t Tell Them).”  Realizing that this was an important topic and one my wife might want to know about, I opened the magazine and scanned the article.

They tricked me because the article was actually about the 10 best husbands in the country or something stupid like that.  Not only did they all look fake with their six-pack abs, nice hair, and thin bodies, their advice was also lame.  I’m not sure they represented men well.  Based on their advice, it’s as if they were either Stepford husbands or eunuchs. Now that I think of it, the misleading title was probably a ruse to entice husbands to read it.

Regardless of that article’s intent, they did a great job getting me interested in exploring more of the article.  In fact this is a common approach for magazine covers.  We could learn from that.  Why couldn’t you design your elearning course to have a similar look and feel?

The Rapid E-Learning Blog - Magazine cover mock up for elearning

What you do is break all of your content into chunks.  Then design your course to look more like a magazine cover with enticing headlines.  The learner clicks a title and it takes them to that chunk of information.

Find a Cure

There’s always a performance-based element to your elearning course.  Otherwise, what’s the point?  Your either sharing information to keep the learner informed or you’re teaching a skill to do the job better.  Most of the times, the course follows a very linear process where everything is laid out a certain way.  And then we walk the learner through the content from A to Z.

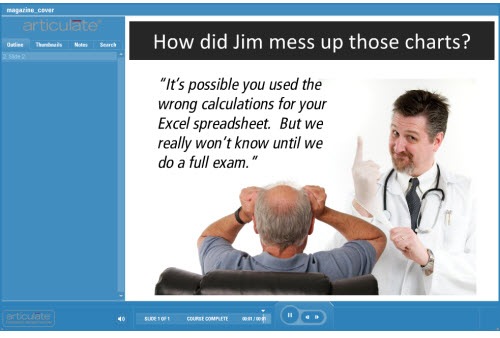
The Rapid E-Learning Blog - Medical investigation approach to elearning

Change things up.  Flip the course around.  Start as if the person is sick and being rushed to the Emergency Room.  The learner’s goal is to diagnose the problem and come up with a cure.  This could be a fun way to present the course topic.

Panel Discussion

Too often in an elearning course everything is a one-sided presentation and doesn’t do a good job handling objections.  This is really true for soft skills training where the learners can usually come up with a bunch of reasons why the approach taught might not work.

Why not create your course as if it were a mock panel discussion with “experts.”  You can use the experts to share your course content and also deal with objections or potential issues.  Or instead of a panel discussion, make it look like a news talk show.

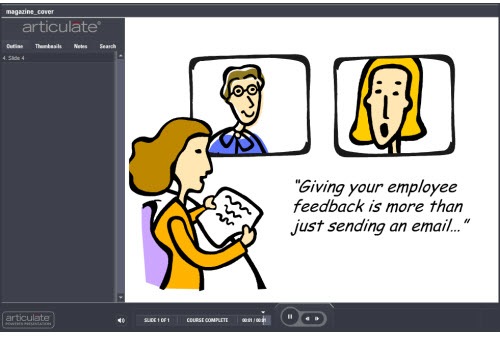
The Rapid E-Learning Blog - Present your elearning course content as a debate or panel discussion

Create a moderator and some characters.  The moderate moves the content along by asking questions.  And then you share the course content via the characters as they debate the subject. 

One of the characters could be a foil who throws a wrench in the conversation.  It’s a good way to deal with the objections learners might have to some of the information.  If you have the time, break out your video camera and use video clips instead of clip art or stock images.

So there you have it, three simple design ideas for your next elearning course.  If they work for you, feel free to use them.  If you do, let me know.  I’d love to see what you come up with.

If they don’t work for you, that’s fine.  The intent here is not to give you the world’s best ideas, but instead to get you thinking about different ways to present your elearning courses.  As in all brainstorming sessions, some ideas are better than others.  However, all ideas are good because they can spawn even better ones.

What are some other ideas that we can add to this list?  What can you share with the rest of us?  Share your ideas and suggestions in the comments box.

If you liked this post, you might also like these:

Events

Free E-Learning Resources

Want to learn more? Check out these articles and free resources in the community.

Here’s a great job board for e-learning, instructional design, and training jobs

Participate in the weekly e-learning challenges to sharpen your skills

Get your free PowerPoint templates and free graphics & stock images.

Lots of cool e-learning examples to check out and find inspiration.

Getting Started? This e-learning 101 series and the free e-books will help.


interactive branched scenario

This post is in response to some conversations I had during the last ASTD conference in Washington, DC.  There were some people who suggested that rapid elearning was only good for basic linear courses and they lamented that they couldn’t build interactive scenarios.

I’ve built hundreds of rapid elearning courses and I can tell you that building branched scenarios with your rapid elearning tools is not only possible, but it’s actually pretty easy to do.

In today’s post, I’ll start by showing you the three-step model I use to build the scenario infrastructure.  Once you know how to do this, you can pre-build all sorts of scenario wire-frames with placeholder content.  Then when you want to use one in your course, it’s just a matter of inserting the pre-built scenario, setting your links, and adding your content.

The Three C’s of Scenario-Building

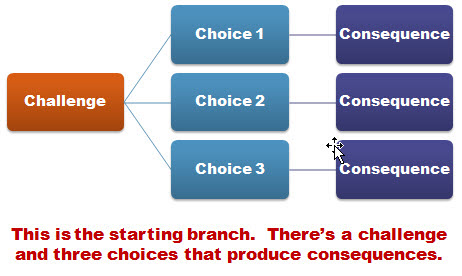
I like to keep things simple.  So I use what I call, the “3C Model.”  Each scenario consists of a challenge, some choices, and then consequences of those choices.  That’s basically it.

The Rapid E-Learning Blog - 3C model for elearning scenarios

When I build out my scenarios, sometimes I’ll use one branch to let the learners test their understanding.  I don’t score it or anything like that.  I just want to give the learner a way to test what they know.  Other times, I’ll use the branch to sort the learner.  If they get it, they move on.  If not, I can send them down a path to get additional info.  With interactive branching you can also convert a linear elearning course into more of a story-like course that both engages the learner and lets them interact with the content.

I start by creating a generic 3C model where I provide a challenge, choices, and consequences.  Then when I want a scenario, I drop in a 3C.  If I want to continue the scenario, I drop in another 3C.  So I can make my branch as simple or complex as I want it to be.  Once I have the infrastructure built, I swap out the placeholder content with my real course content and I’m done.

The image below represents the structure for a generic three-choice branch.  This is what I pre-build.  I also pre-build two-choice and four-choice branches.  Then when I need them, all I have to do is insert them into the course.

The Rapid E-Learning Blog - generic 3 choice elearning scenario branch

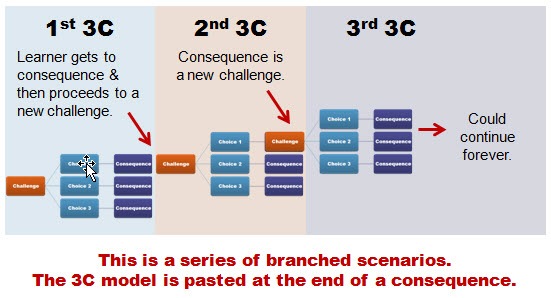
So in the example above, you’re presenting a challenge to the learner.  The learner makes a decision and then selects the appropriate choice.  The choice made produces consequences.  At this point you can provide feedback and have the learner continue through the course.  Or you can add another 3C structure at the end of the consequence.  So you’d end up with something that could look like the image below.

The Rapid E-Learning Blog - adding the 3C model template to branched elearning scenarios

There are a few ways to structure this ongoing branch.  In the first 3C section, the learner gets to the consequence.  At that point, you could provide feedback.  Then move on and present another challenge.

Or you could do what I did in the second section.  Instead of providing feedback, I just jumped right into another challenge.  Thus, the consequence of the choice the learner makes creates another challenge.

To make my scenario-building easier, I have some pre-built scenarios that I can quickly drop into my course.  They represent the generic scenario structure and they’re built with placeholder content which I can easily swap out with the content from my course.

The 3C model is a very simple model to use.  Whenever you want to create a decision-making scenario, just drop in a 3C template.  If you want to continue the scenario, then add another 3C template.  You can add as many as you like and make your scenario as simple or complex as you want.

Just keep in mind that if you want to make a complex scenario (which could provide a very rich learning environment) you really need to understand the subject matter and create something of value.  Don’t just create branched scenarios to be “interactive.”  Make sure that they’re relevant and meaningful.  There’s nothing worse than forcing your learners to click through a meaningless scenario that is both obvious and a waste of their time.

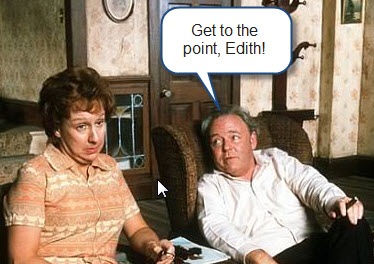
If you can tell the person in one sentence what they’d learn through a ten-click scenario, odds are that you’re better off sticking with the one sentence.  Personally, I’m from the Archie Bunker School of Scenario-building.  I don’t have the patience to click through a bunch of pointless choices.  And my guess is that your learners feel the same way.

The Rapid E-Learning Blog - Archie Bunker quote

One last point, spend some time pre-building all sorts of scenario looks.  Then duplicate them and create versions with different choice options.  For example, each scenario look should have a two-choice, three-choice, and four choice option.  You could add more, but typically, it’s hard to come up with more than four viable choices.  And if you continue the branching, you could end up with a real confusing mess since the options would grow exponentially.

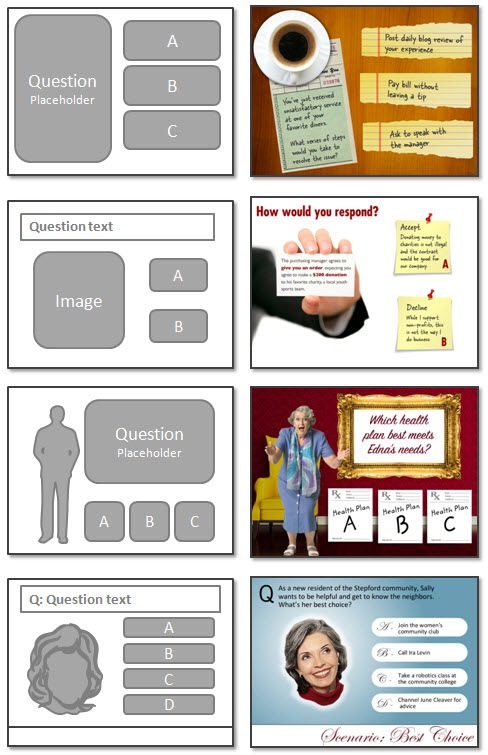
The image below shows three different scenario looks.  There’s the placeholder look that you’d create, and an example of how it might look with real content.

The Rapid E-Learning Blog - before and after examples of scenario templates

As you can see, building a scenario using the 3C model is pretty easy to do.  It always starts with challenging the learner’s understanding or assumptions.  Then you present choices for the learner to make decisions.  Each decision produces a consequence where you can provide feedback or move the learner to a new challenge for more decisions.

Events

Free E-Learning Resources

Want to learn more? Check out these articles and free resources in the community.

Here’s a great job board for e-learning, instructional design, and training jobs

Participate in the weekly e-learning challenges to sharpen your skills

Get your free PowerPoint templates and free graphics & stock images.

Lots of cool e-learning examples to check out and find inspiration.

Getting Started? This e-learning 101 series and the free e-books will help.


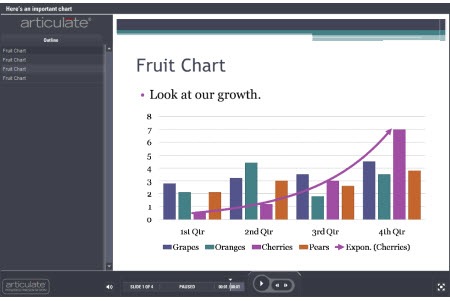
It seems that the last few weeks I’ve previewed a lot of courses that had charts or graphs.  Most of the slides kind of looked like the chart below.  You end up with a lot of information and not quite sure what to do with it.

Today, we’ll look at three sure-fire ways to make your charts and data more memorable.

The chart below tells me to look at the growth, but what growth am I to look at?  Each group has improved from the first quarter to the fourth.  Some more than others.  What does all of this mean?  Why did oranges drop in the third quarter?  Am I even supposed to look at that number?

The Rapid E-Learning Blog - typical PowerPoint chart

This is even worse when you get one of those charts where you’re not quite sure what the chart means.  I’ve seen some charts that make me feel like a dummy.  They’re usually those radar charts or the ones with splatters all over the place.  They could have just as easily been created by Jackson Pollock, because they make about as much sense to me. 🙂

A lot of the discussion about cognitive load deals with the information you share and how it’s processed by the brain.  When you add a chart to your course it’s possible that the chart provides way too much information and makes it confusing for the learner to know what to focus on.

The chart below is a good example.  It’s from the Lawrence Livermore National Laboratory.  When I look at the chart, I’m not quite sure what to do with the information.  Where’s the focal point?  If your learners don’t know what to look at, then they’ll probably be confused or glean the wrong information.

The Rapid E-Learning Blog - confusing chart with a lot of information 

Keep It Simple

Most charts have a lot of information on them; usually more than what’s needed.  If we look at the first chart above, what is it telling us?  There are a lot of things to extrapolate from it.  On top of that, I could focus on the wrong things and infer a cause and effect relationship between the data, perhaps linking decreased orange sales with increased cherry sales.

You’re the one who’s adding the chart to the course.  Do what you can to clean it up and make it more impactful.  At a bare minimum, get rid of some of the distracting elements.  For example, what can you do to add more white space?  One of the problems when converting slides to Flash is that thin lines can lose their clarity.  Do you need all of those lines?  Can you make the data larger and easier to read?

Without a lot of extra effort, I increased the chart to fit the slide.  I moved the key to the bottom; got rid of the gray background; and deleted the chart title.  This helps make the chart a bit more legible.  However, there’s still a lot that can be done to make the information more effective.

The Rapid E-Learning Blog - clean up the basic chart and make it easier to read

Focus on the Key Information

The chart above is an improvement over the first one.  However, there’s still a problem.  I’m not quite sure what I’m supposed to be looking at.  Now, if you actually had this chart in your elearning course, you’re most likely going to include some sort of narration to go with it.  In that case, you can add something like an annotation to draw attention to the information on the chart.  That’s easy enough to do.

However, you still run the risk that the learner is pulling other information out of the chart, which may or may not be correct.  So what you want to do is direct the learner’s attention to the right information.  Below are some examples of what you can do.

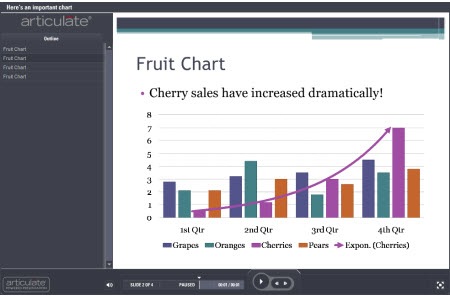
  • Add a trend line.  In the example below, I’m able to draw the learner’s attention to the information that is important, which is the increase of cherry sales that year.  I matched the trend line color to the cherry column and added an arrow to indicate movement.

The Rapid E-Learning Blog - a trendline can add focus

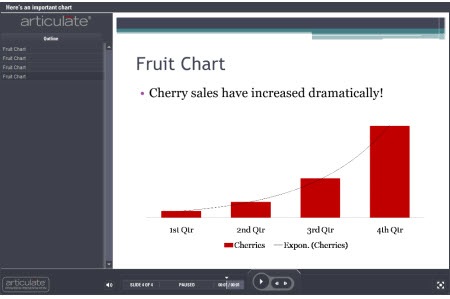
  • Tell the learner what they’re supposed to see.  I added some text that basically tells the learner what the chart tells them.  Cherry sales have increased dramatically.  For proof, they can look at the chart.

The Rapid E-Learning Blog - tell the learner what they should see

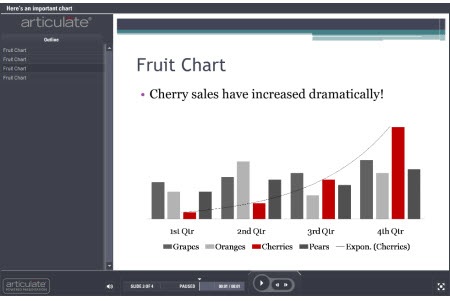
  • Use contrast to create a focal point.  In the chart below, I made the other sales data gray and colorized the information that I want the learner to focus on.  Immediately, you’re drawn to the color and will look at that information first.  Contrast is a key visual design principle and effective in moving the learner’s eye across the screen.  You’ll notice that I also got rid of the lines and numbers on the side to give it more white space.

The Rapid E-Learning Blog - use color contrast to gain focus

  • Get rid of the noise.  In this example, all I want to focus on is the cherry sales.  Why do I need all of that extra information?  This is probably one of the most important considerations when using charts.  What do I need to have on the screen that tells the learners what I want them to know?  Do I need all of that other comparative data?  If not, get rid of it.  It’s just going to confuse the
    learners and distract from what you’re trying to convey.

The Rapid E-Learning Blog - get rid of the noise and distracting data

Don’t Use a Chart

Building charts in the presentation tool is easy.  And because of that, we’re quick to use them.  It’s kind of like using PowerPoint templates.  They make the job easier, but might not really help make the elearning course better.

As you can see from the previous points, all of that extra information about the other fruit sales might not add any value to your course content.  In that case, do you really need a chart to tell your learners that cherry sales have increased?

The Rapid E-Learning Blog - do you even need a chart?

  • Step away from the chart-building tool.  Instead of using a chart, break out the key points that you want the chart to make.  Then build out your content to be more focused and visually interesting than you’d get with a chart or graph.  The cherry sales image above shares the same information but doesn’t confuse you with other sales data.  
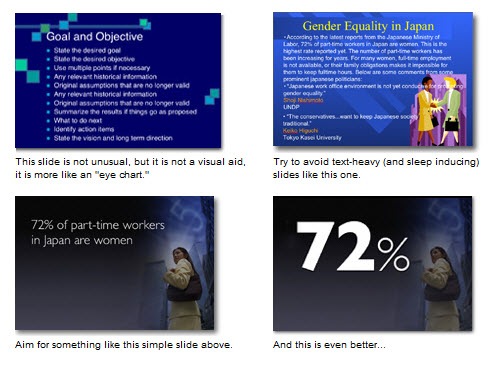
  • Focus on one point per screen.  If you need a chart to tell a few different things, then spread that over a few slides, rather than dumping it all on one screen.  When you do that, you can possibly get rid of the chart itself and make your points in other ways…and make them more memorable.  I like the way Garr Reynolds of Presentation Zen, pulls the key point into focus from the slides below.  You’re going to remember that one point more than you’ll remember all of those bullet points that support it.  The same is true of the data from your charts.  The Rapid E-Learning Blog - example from the Presentation Zen blog
  • Ask why this is important to the learner.  Part of instructional design is to make the content relevant to the learner.  It improves the stickiness of the data.  Find an emotional hook to represent that data.  Most likely a chart isn’t that hook.  Is there a better way to share the data that also adds some emotional impact?  Remember, people aren’t robots that just scan the screen for data.  They’re real people that are swayed by their emotions.  The visual design of your data and its aesthetic value is just as important as the actual data.  Especially if you want it to be memorable.

Check out the Miniature Earth demo below.  What they share could just as easily have been a bunch of boring charts and tables and looked like a UN presentation.  However that would have lost the emotional appeal and definitely make the content less memorable.  How can you hook your learners with the data in your charts?

The Rapid E-Learning Blog - miniature earth demo

Click here to view the Miniature Earth presentation.

Even if you’re building your elearning course in PowerPoint, there’s no reason why you can’t replicate the look and feel of the demo above.  They’re simple graphics and basic fade in and out transitions with some slight animations.  All of that is easy enough to do in PowerPoint.

In either case, when you build an elearning course you’re basically telling a story.  It can be a boring story or one that intrigues the learners.  When you use data from charts and graphs it needs to be part of that story and not just a bunch of data.  Follow sound visual design principles and get rid of the noise that will distract from the key points.  You’ll build better courses that will have more impact.

I haven’t read this book yet, but it was recommended to me and you might find it of value, Stephen Few’s Show Me the Numbers: Designing Tables and Graphs to Enlighten. If you have read it, tell us what you think.

What are some things you do when using charts in your elearning courses.  Share your thoughts by clicking on the comments link.

If you liked this post, try these:

Events

Free E-Learning Resources

Want to learn more? Check out these articles and free resources in the community.

Here’s a great job board for e-learning, instructional design, and training jobs

Participate in the weekly e-learning challenges to sharpen your skills

Get your free PowerPoint templates and free graphics & stock images.

Lots of cool e-learning examples to check out and find inspiration.

Getting Started? This e-learning 101 series and the free e-books will help.